An ICPR 2018 Tutorial, August 20, 2018, Beijing, China
Presented by Tin Kam Ho, IBM Watson (Slides)
In many studies of classifier methods, a typical demonstration of merit for a newly proposed method is by showing experimental results where the method's accuracy is compared to those by the prior art for a set of publicly available datasets. However the claim of merit is often limited to counting how many such datasets the method wins on, with little further analysis into why it wins. While such a demonstration can convey some sense of robustness of a method, it does not give much insight on the conditions under which its merits are expected. To predict the method's success or failure on unseen classification tasks, it requires a leap of faith. Data complexity analysis was motivated by the realization of this unsatisfactory state of affairs. We developed a number of measures that can highlight the differences between easy classification tasks and difficult ones. These measures thus give a feature space where the complexity of classification tasks can be analyzed with the tasks taken as points in this space.
In this measurement space, we found that real-world classification problems span structures that are significantly different from randomly labeled point sets (noisy patterns that have no regularity to be learned). Distributions of real-world problems in this space show that there exist several independent factors affecting a problem's difficulty. In the space one can map the position of each classification task and compare its position to others, thereby drawing some expectation of how a classifier may perform on that task from the known records of other neighboring tasks. One may also compare the regions that contain the tasks for which one classification method consistently outperforms others, and thereby mapping the ``domain of competence'' of the classification method. This can guide static and dynamic selection of classifiers for specific problems as well as for the variations of the same problem that are formed by confinement, projection, and transformation of the feature vectors.
In an application context where the definitions of the classes are changeable, one may use the complexity measures to guide the choice on alternative definitions so as to optimize prediction accuracy for the resultant classification task. This allows for better tradeoff in the relevant context, e.g., between the precision of the prediction and the confidence of the prediction.
Recent interests in meta-learning and transfer learning seek to retain reusable learned knowledge (e.g. feature extractors, parameters of mapping functions) from one classification task to another. One way to make the decision to switch to a different parameter or configuration choice for each task is to leverage some measures of the geometrical characteristics of the data. Similarly, recent research on ``AutoML'' (automated machine learning) seeks to automatically tune the classifier parameters to adapt to each task, or even to tune the learning process end-to-end where the choice of the classifier is also automated. There is a good chance that data complexity analysis can contribute towards these goals.
Classification tasks fall on a continuum between very easy and very hard ones.
Example measures that characterize classification complexity.

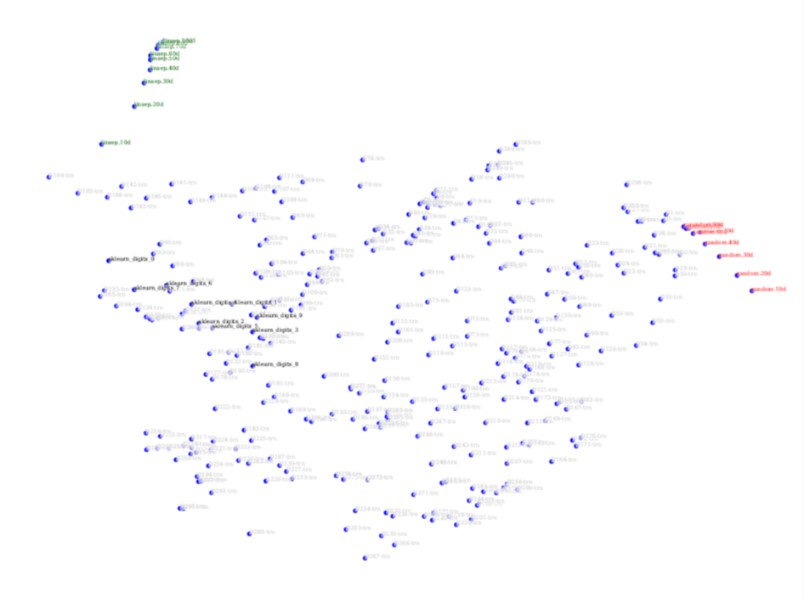
A map of classification tasks in two complexity dimensions: easy, linearly separable problems (green), randomly labeled points (red), 10 classes of handwritten digit images (black), and a collection of synthetic datasets representing many other realizations of complexity (light gray).